

One of the most frequent questions founders and employees ask Liquid Stock is, “What is my stock worth?” This question has become even more prevalent as the public and private technology markets have experienced significant valuation compression followed by a quicker than anticipated resurgence. The question is so crucial to the ending net worth of founders and employees of Pre-IPO companies, we decided it merited creating a roadmap for employees and shareholders to help them draw their own conclusions in answering this critical question.
Valuation, Duration and Probabilities
It never ceases to amaze us how much time people spend on different things in life without fully understanding the value of their most valuable asset. Having a point of view on probable outcomes, both in terms of duration until a liquidity event and likely valuation ranges, can significantly impact your ending net worth. As Charlie Munger famously quipped, “If you don’t get this elementary, but mildly unnatural, mathematics of elementary probability into your repertoire, then you go through a long life like a one-legged man in an ass-kicking contest!”
For option holders, knowing whether to exercise options based on their company’s 409A is key. The employee’s perspective on the likely timeline to liquidity and probable exit valuation ranges should guide their decision whether to exercise, and the decision can often mean a difference of millions. In addition to these questions, option holders should understand the difference in the type of equity grant they hold and strategies to optimize taxes.
For shareholders, knowing today’s value and being able to evaluate and compare secondary offers, tender offers, structured equity financings, recourse loans, and sitting tight, similarly can result in widely different outcomes.
Access to Information; Knowledge is Power
The challenge for some employees is that just as private company valuations are blurred in the private markets, sometimes so is their own company’s data. If you are a founder or C-Suite executive that’s still with your company, that typically isn’t a problem, but for others securing basic financial information is the starting point. There is a science (and some art) in gathering enough data points to create a point of view on the key questions and answers in and around valuation and probable outcomes. The most important homework exercise to make an informed decision is to access as much information as you can about your company, its market, and its competitors.
The starting point is requesting company information, including the company’s 409A report. Some companies may not provide it, but it’s your right to review it. In any event, some companies are required to provide Rule 701 disclosure. This little-known, and sometimes not followed disclosure obligation, can often be the bridge to information for employees looking to determine the value of their equity.
For Founders and C-suiters who have full access, the information-gathering exercise isn’t done, as they should also gather as much information as possible about competitors and their valuation. It’s helpful to start with any public company competitors where valuation metrics and multiples are more readily available.
Valuation Metrics
Yesterday’s valuation paradigm focused on growth. In the private markets, investors were historically paying ahead of revenue or ARR, betting on the company’s ability to “grow into” its valuation. The higher the growth, the faster it “grows into” that number. For example, if a company is growing at 300%, a 40x valuation multiple will become a 10x valuation multiple in just a year. The general rule is that higher growth rates command higher multiples. As growth rates decline, so do valuation multiples.
Today, profitability has become king. Business models that rely on growth and future financings are being heavily discounted. Some technology companies are being valued on more traditional multiples of Earnings Before Interest Depreciation and Amortization (EBITDA), while others remain valued on multiples of revenue or ARR. Understanding this paradigm shift, and where your company stands on the scale, will help guide your understanding of the current value of your company.
The valuations that different industries command vary widely as well, sometimes due to the size of Total Addressable Market itself, but also because of the correlation to different underlying growth and profitability rates. The industries that have commanded higher multiples over the past decade are fintech, security, and data infrastructure. Today, AI and machine learning are still driving yesterday’s multiples, but the timeline for a liquidity event for many of these companies is more uncertain. Following Zanbato’s data on where your industry’s multiples have trended is an additional interesting data point.
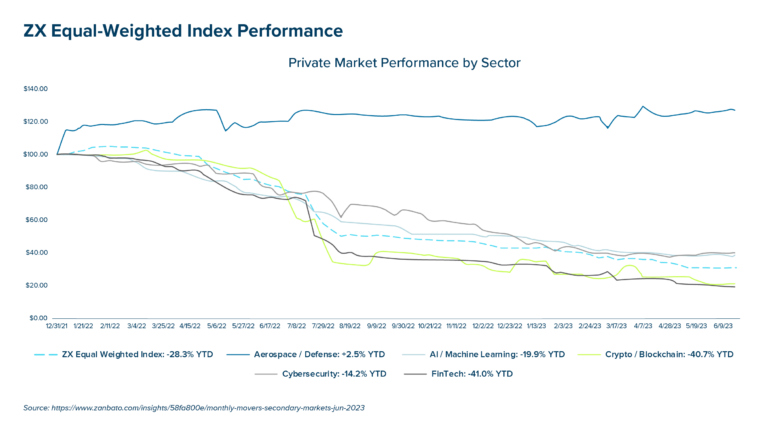
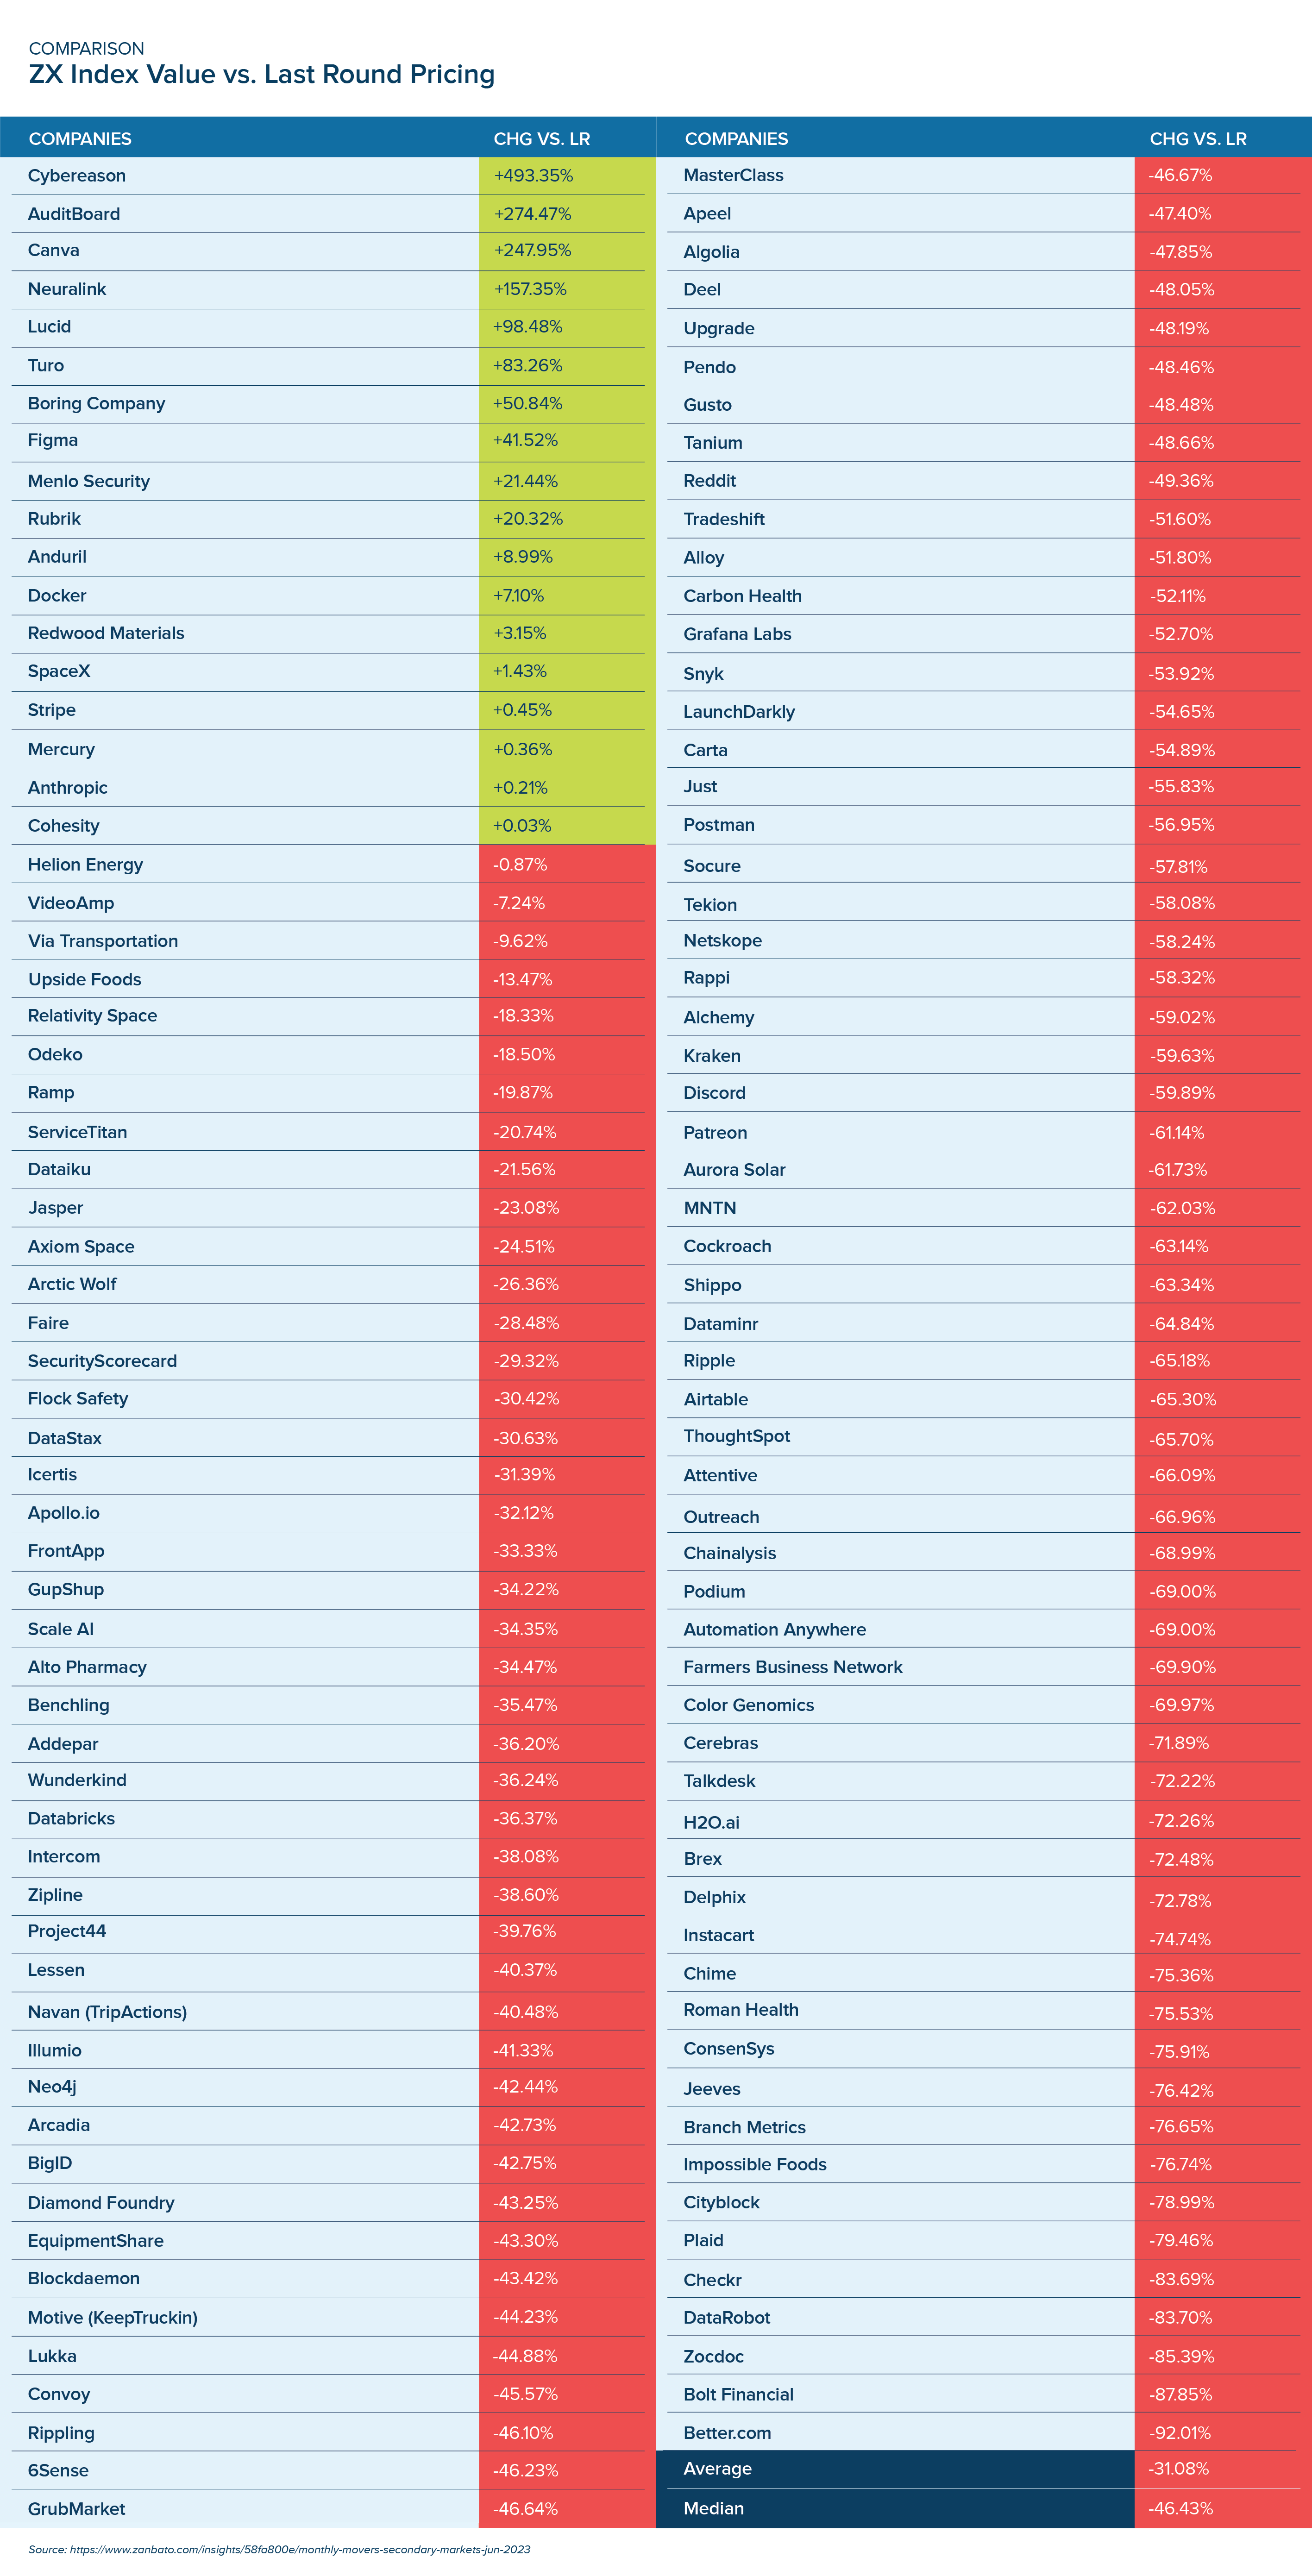
Many employees and founders also tend to anchor their thinking on the valuation established in the last round. The last round valuation is a data point, but it isn’t determinative of the current value of your equity. In particular, understanding the difference between the value of common versus preferred equity, changes in valuation multiples, and company performance since the last round, are components of determining today’s value. Secondary market trading provides another interesting lens to understand how these variables impact valuation. On average, the ZX Index Values for June showed a 31% decrease compared to the last round price per share. However, for companies that completed their last financing round in 2022 or later, their ZX Index Values experienced an average decrease of 24% compared to the last round.
I asked Akrati Johari, the Chief Growth Officer at Zanbato, what insights she has gained in recent months based on the trading values of companies and how employees may be able to utilize Zanbato data to gain a perspective on their own company. Akrati shared “We are starting to see secondary market prices stabilize and saw in June that secondaries were unchanged month over month. We have also seen a lot more buy interest come into the market over the last couple of months. In June, we saw 44% buy interest which is the highest volume of buy interest we have seen in the last 12 months. Bid-ask spread, which is the difference in price that a buyer is willing to pay and a seller is willing to accept for the top 50 companies, was at 8% in May and June, which is the lowest we have seen in the last 12 months. All of these trends are pointing towards what we are expecting to be a much more active secondary trading market in the second half of this year. Ultimately, employees can use our data to get better price transparency into the secondary prices of these private companies which can ensure they are getting the best pricing for their shares.”
The Future and Probability of Outcomes
Ultimately, wrapping your head around today’s valuation is only part of the analysis. The true art lies in determining the probability of outcomes for the future. As the financings and valuations of 2021 prove, even the “experts” demonstrate that the future is uncertain. That said, with enough company, market, and historical valuation information, determining a range of probable valuation outcomes and times to liquidity is critical. Studying your after-tax ending net worth within the probable outcome ranges is instrumental in guiding your decisions, optimizing your taxes, and maximizing your net worth.
At Liquid Stock, we believe this exercise is so crucial that we share simplified models of our transactions, allowing you and your advisors to toggle key variables and examine different outcomes for your alternatives. We encourage equity holders to consider their own views on the value of their equity and think strategically about how to maximize it. We also believe that not getting too caught up in valuations when they are at all times highs, or panicking at times like these, are also generally good guide rails to consider.
The future, by definition, is uncertain, but we believe Mr. Munger certainly got it right!
This blog post is intended for general informational and educational purposes only. Liquid Capital Management, LLC (together with its affiliates, “Liquid Stock”) makes no representations as to the accuracy of information in this post, and no representations or guarantees as to specific outcomes from relying on this post. No content in this post is intended or should be construed as tax, investment, legal or accounting advice by Liquid Stock, or as an offer to sell or solicitation of interest to purchase any securities offered by Liquid Stock. Liquid Stock does not provide tax or other financial, legal, or regulatory advice to its transaction counterparties. Always consult with your investment, tax, and legal advisors before making important financial decisions. Transaction models shared by Liquid Stock should not be deemed advice of any kind. The terms of any Liquid Stock transaction may vary. Outcomes (including financial and tax outcomes) of any transaction will depend on factors including the timing and value of any liquidity event. Liquid Stock makes no representations or warranties as to the outcome of any transaction, including in any model or other material it shares with counterparties. While reasonable steps have been taken to ensure that the information herein is accurate and up to date, no liability can be accepted for any errors or omissions. All views and information contained herein are as of the date hereof and subject to change. Views and opinions presented are those of the author. Information contained in third-party links has not been independently verified by Liquid Stock and inclusion of such links should not be interpreted as an endorsement or confirmation of the content therein. Prospective investors considering an investment in a Liquid Stock fund should not consider this content as fund marketing material.